Reader Tony asked a good question this week, and after writing a lengthy response in the comment section, I decided it was worth posting here for others to see. Tony's question:
If we knew that, for example, Santi Cazorla was going to hit the target once every week, regardless of opponent, and we know that those SoT, on average, get converted into goals approximately 33% of the time, we'd expect him to score every three weeks. If he'd gone five weeks without a goal, that 33% rate doesn't change and thus we'd still give him a 1/3 chance of scoring next week. It's tempting to suggest that over those six games Cazorla should have two goals (from his six shots), and indeed if we were forecasting the next six games, we'd forecast him to score twice, but not to the point that we are compensating for his missed chances
By looking at those players who have under produced versus their underlying stats, we can identify players who may be undervalued by the market, but we would not forecast their production to exceed the average to 'catch up' for chances missed in the past. This is an important point, so let's look at an extreme (fictitious) example to suggest one pitfall of only looking at those players who have unperformed their underlying stats:
Player A: 10 games, 12 SoT, 2 goals
Player B: 12 games, 16 SoT, 11 goals
It's not hard to identify that both players should regress in the future (assuming you accept my premise that most players have shown little ability to control how many of their SoT become goals). Using a simplified 33% conversion rate, Player A's 12 SoT 'should' have netted him 4 goals, thus if he continues to take shots at this same rate, we'd likely see him to enjoy his next 10 games more than his performance to date. Conversely, it's easy to see that Player B has overachieved compared to our expectation, which would have seen him net just 5.3 times given his 16 SoT. So Player A is undervalued and should be bought, while Player B is overvalued and should be sold, right? Well, no. Over the next 10 games we would forecast Player A to score 4.0 goals, which is an improvement, but still less than the 4.4 we'd forecast Player B to score.
What you need to balance here is the fact that Player A is likely held by considerably less managers than Player B so could represent a differential opportunity. You'll also want to look at whether Player A has something in his profile that would indicate that his underlying stats might improve (more shots taken inside the box lately, a new role, new teammate etc).
So, while the players underperforming their stats aren't necessarily 'due' for improvement, over a long enough period we would expect their production to improve and would thus classify them as undervalued. I've posted a variance of the below before, but for reference, the below charts show expected points (xP) based on their shot data to date plotted against actual points and thus highlight players who may be undervalued:
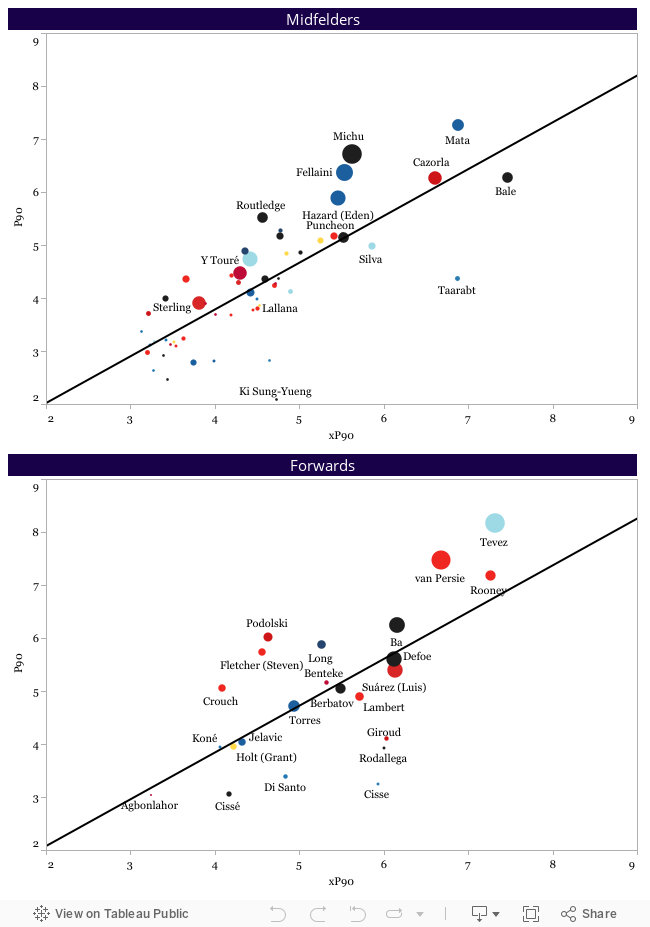 Note: The size of each player's 'bubble' represents their current ownership percentage
I know we always say that things even out over the season but do you think it takes that long? I wonder if you measured a player's expected points over a 1 or 2 month period would it match up to his actual points? We could therefore start to predict when a player is 'due a big win'.Being 'due' is a tricky proposition. Although some fans don't like to reduce their beloved heroes to a statistical probability, that is all we're really doing on this site and once you make that leap, the idea of being 'due' kinda falls into the gambler's fallacy (the notion that after rolling 'black' five straight times, the roulette wheel is bound to come up red). I say kinda because it depends whether you believe that (a) each player has little or no control over how his shots on target are converted into goals and (b) that each week is independent of the last (i.e. that 'form' doesn't exist when it comes to converting chances).
If we knew that, for example, Santi Cazorla was going to hit the target once every week, regardless of opponent, and we know that those SoT, on average, get converted into goals approximately 33% of the time, we'd expect him to score every three weeks. If he'd gone five weeks without a goal, that 33% rate doesn't change and thus we'd still give him a 1/3 chance of scoring next week. It's tempting to suggest that over those six games Cazorla should have two goals (from his six shots), and indeed if we were forecasting the next six games, we'd forecast him to score twice, but not to the point that we are compensating for his missed chances
By looking at those players who have under produced versus their underlying stats, we can identify players who may be undervalued by the market, but we would not forecast their production to exceed the average to 'catch up' for chances missed in the past. This is an important point, so let's look at an extreme (fictitious) example to suggest one pitfall of only looking at those players who have unperformed their underlying stats:
Player A: 10 games, 12 SoT, 2 goals
Player B: 12 games, 16 SoT, 11 goals
It's not hard to identify that both players should regress in the future (assuming you accept my premise that most players have shown little ability to control how many of their SoT become goals). Using a simplified 33% conversion rate, Player A's 12 SoT 'should' have netted him 4 goals, thus if he continues to take shots at this same rate, we'd likely see him to enjoy his next 10 games more than his performance to date. Conversely, it's easy to see that Player B has overachieved compared to our expectation, which would have seen him net just 5.3 times given his 16 SoT. So Player A is undervalued and should be bought, while Player B is overvalued and should be sold, right? Well, no. Over the next 10 games we would forecast Player A to score 4.0 goals, which is an improvement, but still less than the 4.4 we'd forecast Player B to score.
What you need to balance here is the fact that Player A is likely held by considerably less managers than Player B so could represent a differential opportunity. You'll also want to look at whether Player A has something in his profile that would indicate that his underlying stats might improve (more shots taken inside the box lately, a new role, new teammate etc).
So, while the players underperforming their stats aren't necessarily 'due' for improvement, over a long enough period we would expect their production to improve and would thus classify them as undervalued. I've posted a variance of the below before, but for reference, the below charts show expected points (xP) based on their shot data to date plotted against actual points and thus highlight players who may be undervalued:
No comments:
Post a Comment